From February through the 2026 tournament, Ubunifu Madness claimed to predict college basketball games with 79.6% accuracy. The figure came from an ensemble model I had trained on about 165,000 games, and I put it on the site, in the README, and on my resume.
The model was leaking. The real number was closer to 71%.
I had already caught this exact error once, a few weeks earlier, in this same project, and then walked past it a second time.
The first time
While I was training the model, I added a head-to-head feature: how two teams had done against each other earlier in the season. When I validated it, accuracy went past 90%.
What I felt was not excitement. It was alarm. College basketball is hard to predict, which is most of what makes it worth watching and the whole reason I wanted to build this. A model that gets nine games out of ten right has either found something nobody else in the sport has found, or it is reading the answer off the page. That number should have produced a "what is going on here" moment, and it did, just not the good kind.
The cause was not hard to find. The feature was built from a window that included the game being predicted. I removed it, retrained, landed at 79.6%, and told anyone who asked that the lesson was to stay suspicious of good news.
Then I shipped 79.6% without turning any of that suspicion on it.
Why the second number got a pass
The second number felt safer for two reasons. It was lower than the one I had already caught, and it had survived a leak check. I read both of those as evidence. Neither one is.
Looking back, the instinct was right and the method was sloppy. The alarm at 90% did not come from the number. It came from knowing the sport. Ninety percent is unremarkable in plenty of machine learning problems, reading handwritten digits or filtering spam, and absurd in college basketball. What set it off was a season of watching games, not a threshold I had written down anywhere.
Which means I had everything I needed to question 79.6% as well, and I did not use it. I compared the number to my previous number instead of comparing it to the sport.
When I finally did that work, two independent methods agreed. One fits team strengths on each season's own completed games, a time machine with perfect hindsight, then cross-validates. The other splits scoring margin into a real strength difference plus irreducible per-game noise. Both put the best achievable accuracy at roughly 73% in the men's game, and roughly 78% in the women's, where seeding is a stronger signal and upsets are rarer. Per-game scoring margin carries a standard deviation of about 10.7 points that no amount of data removes, because teams have off nights.
So 79.6% was not optimistic. It was above the ceiling, and it had been sitting on the front page for months.
There was a second signal I had been explaining away. The live accuracy tracker on the site read 67%. I had been reading the twelve-point gap as a rough season rather than as the site contradicting itself in public.
What was actually in there
Once I went through the features properly, three things came out.
The Elo rating was joined to games by season rather than by date. Only the last write per team survived, so the stored value was that team's rating at the end of the season. A November game was scored with a number already shaped by what happened in March. Every training row knew how its own season turned out.
A feature called conf_tourney_wins counted how many games a team won across its conference tournament, and then served that value for games inside that tournament. Single elimination means the eventual winner almost always finishes with more wins than whoever it played. The sign of that difference on its own called 98.8% of conference tournament games.
And efg_trend, which by its name is a shooting statistic, was defined as last_n_winpct - win_pct. There is no shooting in it. It is arithmetic on two features the model already had. It was also null in production for every team and had been for months with no visible effect, which should have been the loudest signal of the three. Two separate reviews recommended building a pipeline to populate it. Nobody, including me, read the definition first.
Deleting it
Knowing the number was wrong did not tell me what to replace it with, so I ran the comparison I should have run at the start: the ensemble against the plain Elo rating sitting inside it, on identical games, with every feature computed only from what was known before tip-off.
Elo won. Brier score 0.187 against the ensemble's 0.212 for the men's game, and 0.163 against 0.181 for the women's. When the two disagreed about who would win, the ensemble was right 41% of the time. That is worse than a coin flip: when the extra features overrode Elo, they made the answer worse more often than they improved it.
The 43-feature model was losing to one of its own inputs.
So I deleted it. Features, artifacts, calibration layer, all of it. The site now runs on Elo with a margin-of-victory adjustment and separate parameters for the men's and women's game. The published accuracies are 71.3% and 75.7%. Both sit below the 73% and 78% ceilings I had estimated for the men's and women's game.
The bug that made the point for me
There was a rule I had been proud of. Every surface goes through a single prediction function, so there is exactly one number for any matchup and exactly one place to fix when it is wrong.
That was the design. It was not what was running.
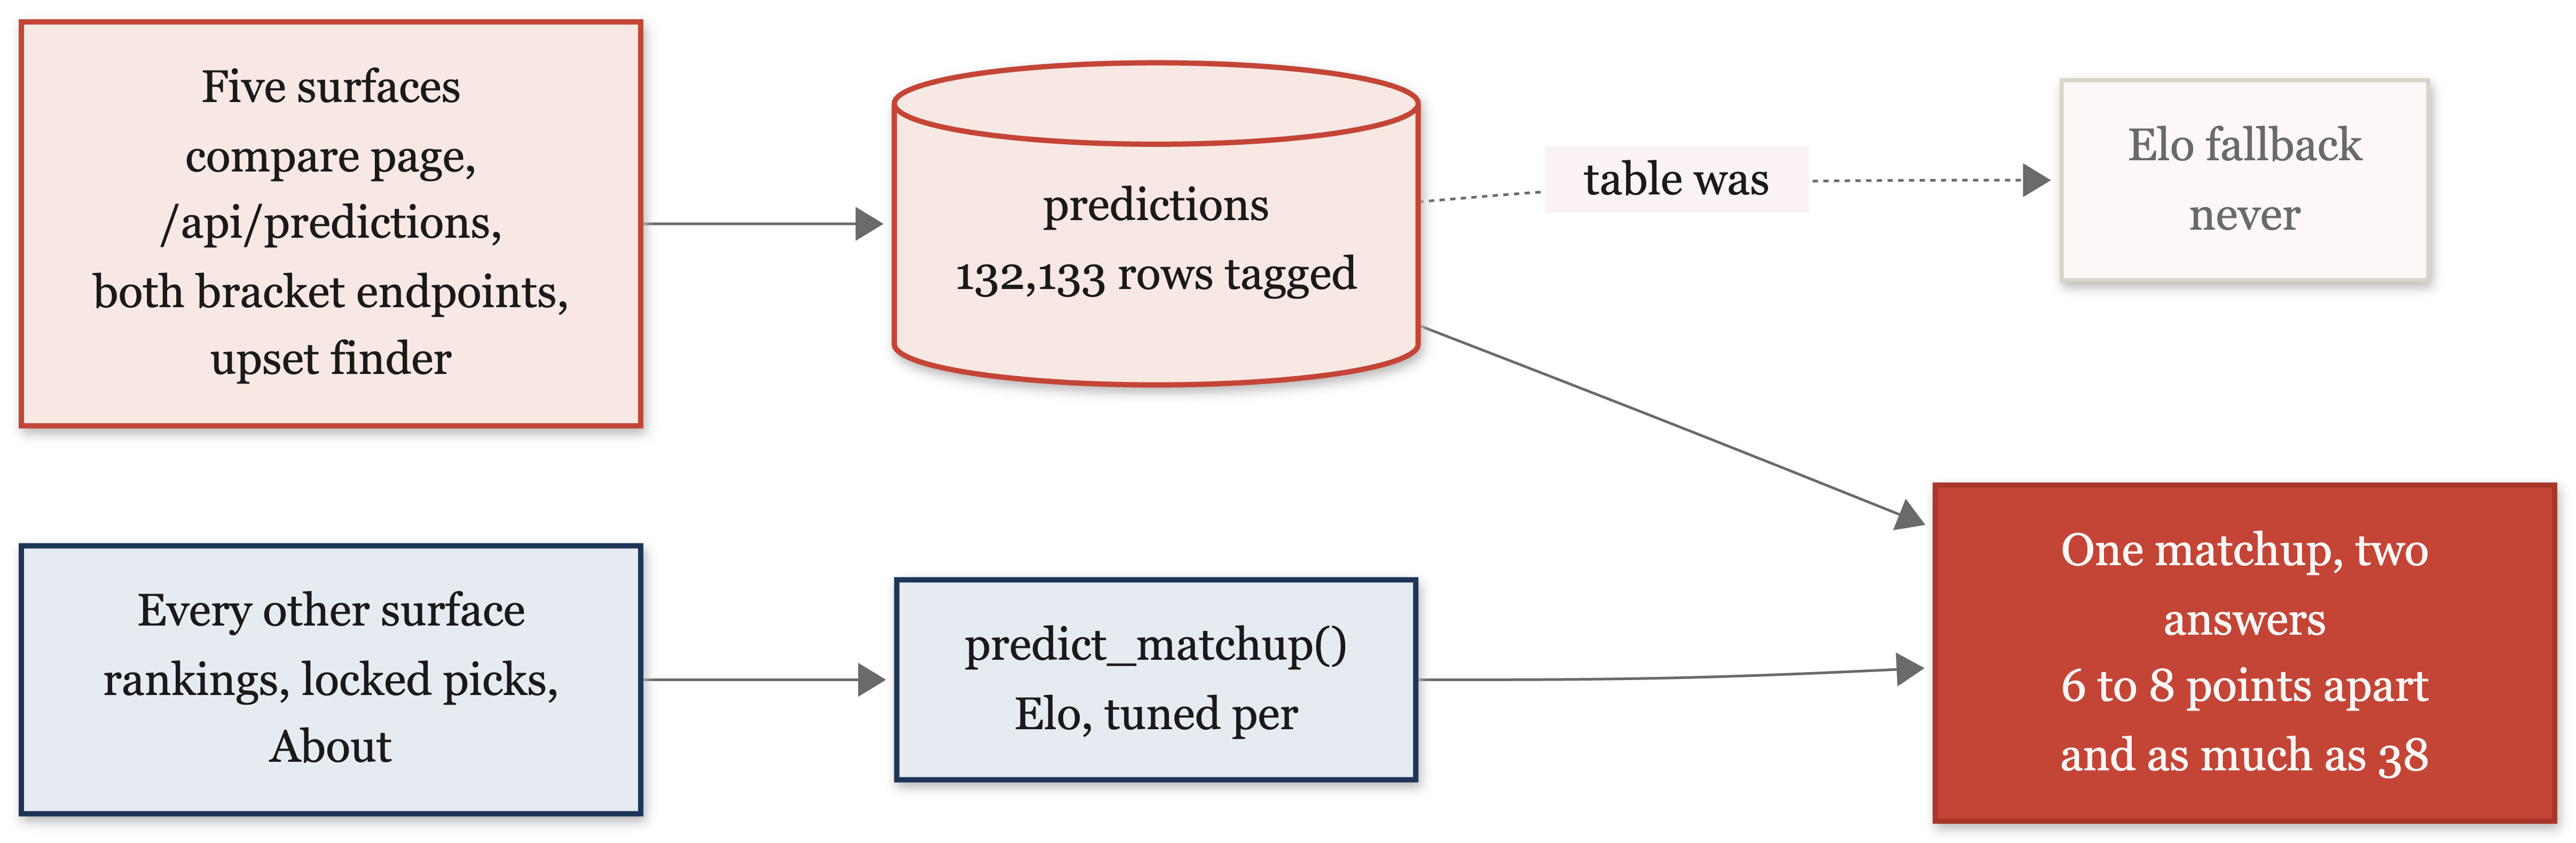
An old table still held 132,133 rows of the ensemble's output, imported from a Kaggle submission and never regenerated after the model changed. Five surfaces read it: the compare page, the predictions endpoint, both bracket endpoints, and the agent's upset finder. Each of them had an Elo fallback, and because the table was fully populated, none of them ever reached it. Those five served the old model. Everything else served the new one. They disagreed by six to eight percentage points of win probability on average, and in the worst case by 38.
Nothing raised an error. From each page's point of view, it had asked a question and received a plausible answer. It had been that way since the day I switched models.
What I would actually take from this
I spent real effort making the chat agent honest. Eight tools, a rule that it must state the exact probability the tool returns, no rounding and no adjusting. What that effort did not cover is that an agent is only ever as good as the context it is handed. Mine followed its rules perfectly and still told people the wrong thing, because the tool underneath it was reading a stale table. No amount of prompt discipline fixes that, because the model has no way to know that the number it was given is three months out of date.
Which is an argument for boring code, not against it. The parts of this system I trust most now are the deterministic ones. A single scoring function. A test that fails if anything imports the old model again. A back-test that runs the production engine walk-forward and fails the build if accuracy drifts from the number I published. None of them reason about anything. They refuse to be wrong in one specific way, every time, whether or not the layer above them is having a good day.
The check I skipped has the same shape. Work out the best score anyone could get before deciding whether yours is good. The estimate comes from the sport rather than from the model, so it does not depend on your pipeline being correct, and that is what makes it usable when your pipeline is the thing under suspicion.
A model of this sport reporting better than roughly 73% for the men's game, or 78% for the women's, is worth checking for leakage before anything else. Mine was leaking.