Crisis Intervention Team training is the dominant mental-health reform in American policing: a forty-hour curriculum meant to help officers de-escalate encounters with people in crisis. The intuitive expectation is that trained officers use less force. I set out to test that against ten years of Seattle data, as a replication and extension of Xavier Aguirre's 2022 master's thesis at CSU San Bernardino, which used the 2015 to 2020 window, and found the opposite of what I expected. The more interesting work was figuring out what the result actually means.
The data and the models
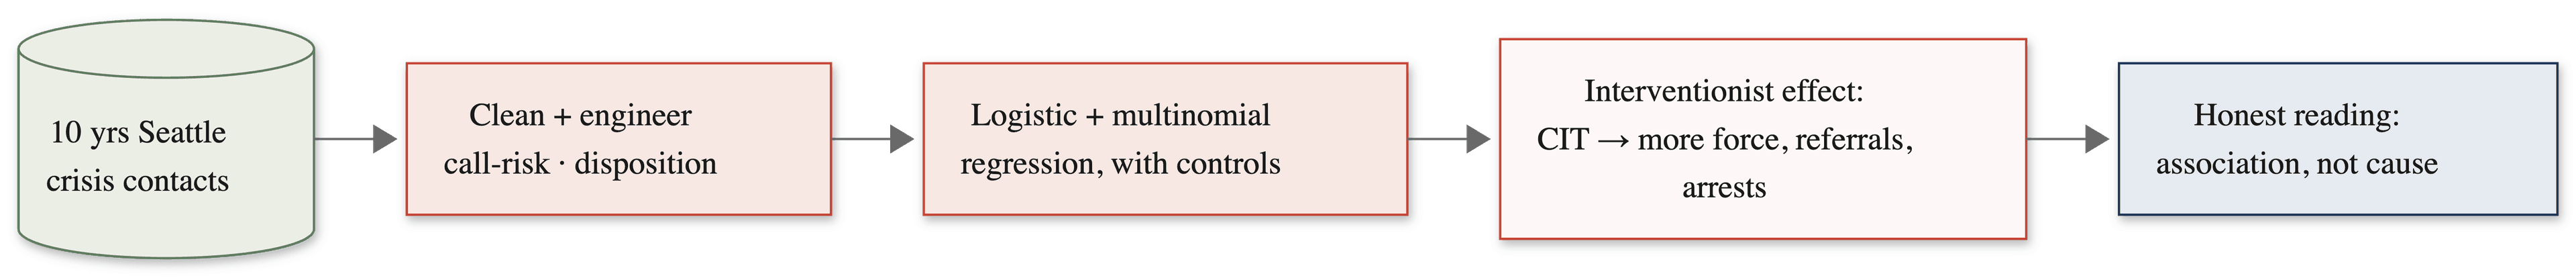
The source is Seattle Police Department's open crisis-contact data, a public dataset of more than a hundred thousand individual contacts from 2015 to 2025, each a single disposition record with twenty-five fields. Cleaning meant dropping records with impossible officer-experience values, mapping the yes/no indicators to numbers, and engineering two variables that carry a lot of the analysis: a disposition group (arrest, emergent detention, referral to services, no action) and a call-risk group derived from the initial call type, which is my proxy for how dangerous the encounter was before any officer decision.
I fit two models. The first is a binary logistic regression on whether force was used, with CIT certification and officer experience as the predictors of interest and controls for call risk, precinct, officer race, and officer gender. The second is a multinomial logistic regression on which disposition occurred, with no action as the reference category, controlling for call risk and precinct. Reference categories were chosen for interpretability, and odds ratios come from exponentiating the coefficients.
The finding that inverted the hypothesis
CIT-certified officers were associated with about thirteen percent higher odds of using force (odds ratio 1.13, p equals 0.027), not lower. The same officers were also more likely to refer people to services (about twenty-seven percent), more likely to make an arrest (about forty-five percent), and more likely to use emergent detention. Across the board, the pattern is not "more force" so much as "more of everything, and less of nothing."
That is the reframe the result earns. CIT does not appear to turn officers into passive de-escalators. It appears to make them act, therapeutically and in enforcement both, instead of leaving an encounter unresolved. I call it the interventionist effect. It complicates the prior research because it means a training program can succeed at one of its goals, connecting people to services, while moving the headline number, use of force, in the direction nobody intended.
Why I trust it more than the headline
A finding like this invites an obvious objection: maybe CIT officers are simply sent to harder calls. I did not want to wave that away with a control variable, so I tested it. The data shows dispatch is roughly balanced across CIT and non-CIT caseloads on the highest-risk call types (they are 9.6 percent of CIT officers' crisis contacts and 9.2 percent of non-CIT officers'), which is evidence against the selection story rather than an assumption against it. I also let the data revise my own framing here, because the original hypothesis had assumed the selection effect would dominate.
The other thing the models make clear is proportion. By far the strongest predictor of force is not training or experience, it is the nature of the call: a violent or high-risk call carries something like six and a half times the odds of force relative to a general crisis or welfare call. Against that, the CIT effect is real but small. The situational factors have to lead, not the training coefficient, and the analysis does.
Reading the number honestly
This is observational data, so the correct verb is "associated with," never "causes." CIT certification is voluntary, which means officers self-select into it, and the data does not capture the things most likely to drive force in the moment, like whether a weapon was present or whether the person was intoxicated. Those unmeasured factors are exactly the kind that could produce this association without any causal arrow.
It also matters that an odds ratio is not a probability. Force is used in only one or two percent of these contacts, so thirteen percent higher odds is a fraction of a percentage point in absolute terms. The estimate is not precise, either: its 95 percent confidence interval runs from about 1.01 to 1.26, so it clears statistical significance but only barely. "Thirteen percent more likely to use force" is true as an odds statement and would be badly misleading read as an absolute risk, and the report is careful about that distinction. A multinomial odds ratio is also relative to the reference, so "forty-five percent more likely to arrest" means relative to taking no action, not relative to every other outcome.
I built the communication layer around these caveats: a forest plot of the force-model odds ratios on a log scale, and grouped bar charts of how disposition shifts with certification, all in Plotly so a non-technical reader can see the confidence intervals and judge the uncertainty for themselves.
What I would do differently
The biggest open question is time. A lot changed in Seattle policing after 2020, and I did not put an era term in the model, so I cannot separate a training effect from a period effect. I would add that next. The analysis is also Seattle-only, the call-risk buckets are coarse, and one row is one contact rather than one incident, so an incident involving several officers is counted several times. None of these sink the finding, but each is a reason to hold it as a careful, single-city result that complicates the story rather than a verdict that closes it.